How to View Watering Schedule and History Reports
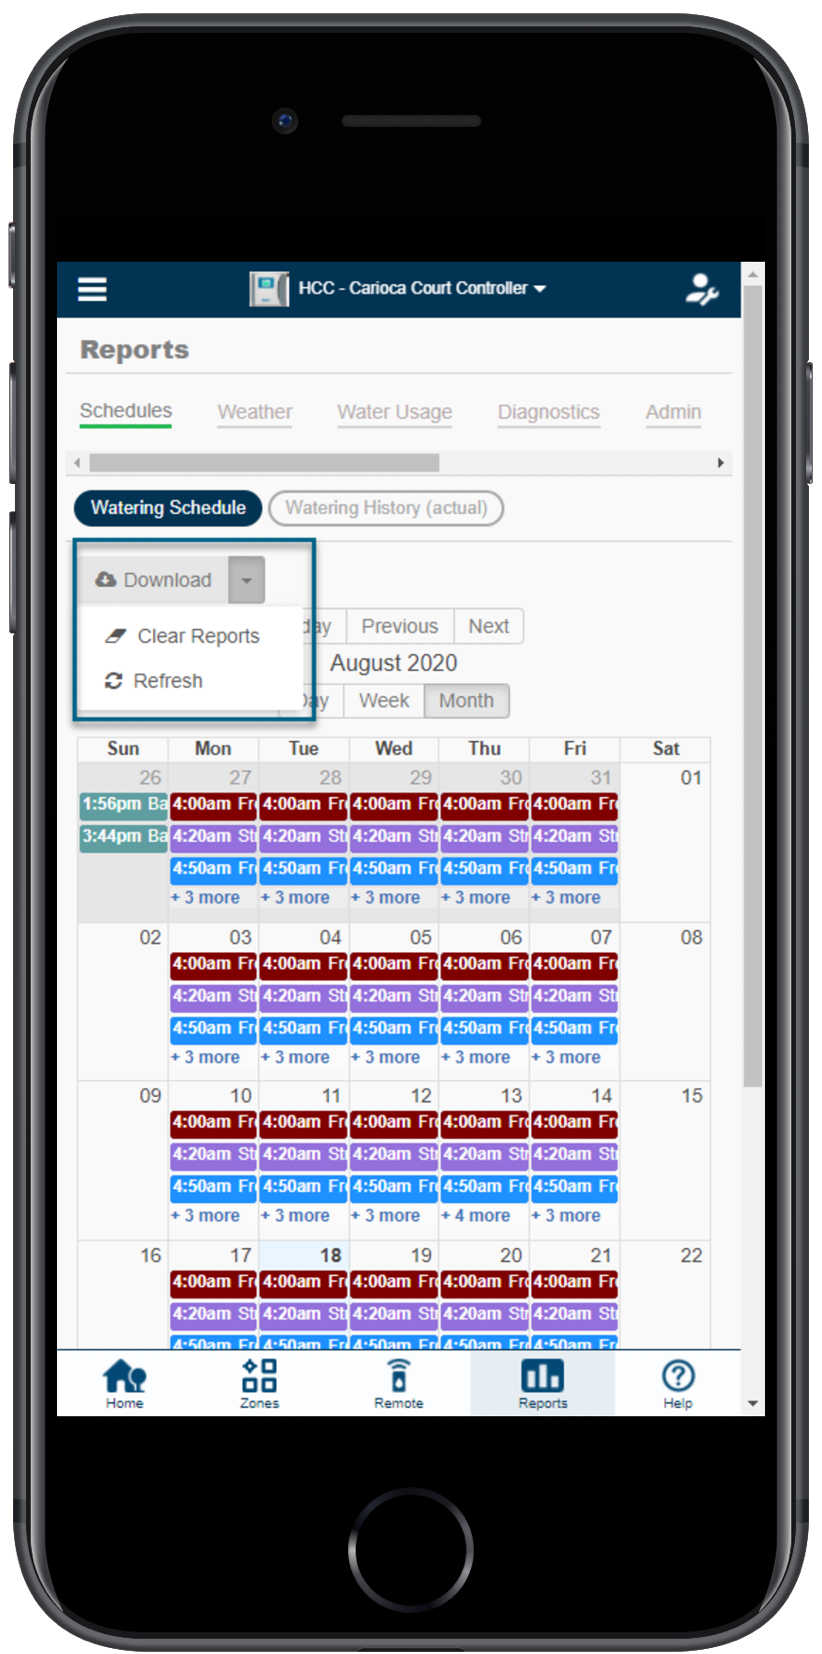
Select REPORTS from the main menu (or for the mobile version, select REPORTS at the bottom next to the help icon) to access the watering schedule and history reports for your controllers. Use the settings on the SCHEDULES report tab to change or view the following:
- Watering Schedule
- Watering History (Actual)
- Download a report to Excel, clear all report data, or refresh a report
You can view reporting history for up to 30 days on the HOME plan and 365 days on the ENTHUSIAST plan.
Use the switching views on the calendar to see the schedule by day, week, or month. Hover over each zone to view the scheduled start time to run, length of run, and day set to run.
If you see lines crossed through any of the zones, this indicates a SENSOR or WATER TRIGGER canceled the watering. Learn more here.
This report shows actual, completed watering times for each zone. Hover over each watering time to see more details about the watering. If no watering appears on certain days, one of the following events occurred:
- A SENSOR or WATER TRIGGER canceled the watering. Learn more here.
- The actual watering might not appear, but the system still watered. In this instance, the controller most likely lost the Wi-Fi signal prior to the system turning on and did not record the event.
Use the cloud icon to download each schedule to an Excel spreadsheet. You can clear all reports but please be aware that if you choose this option, you cannot retrieve the data. Refresh the report to ensure you are viewing the most recent report data.

How to View Weather Reports
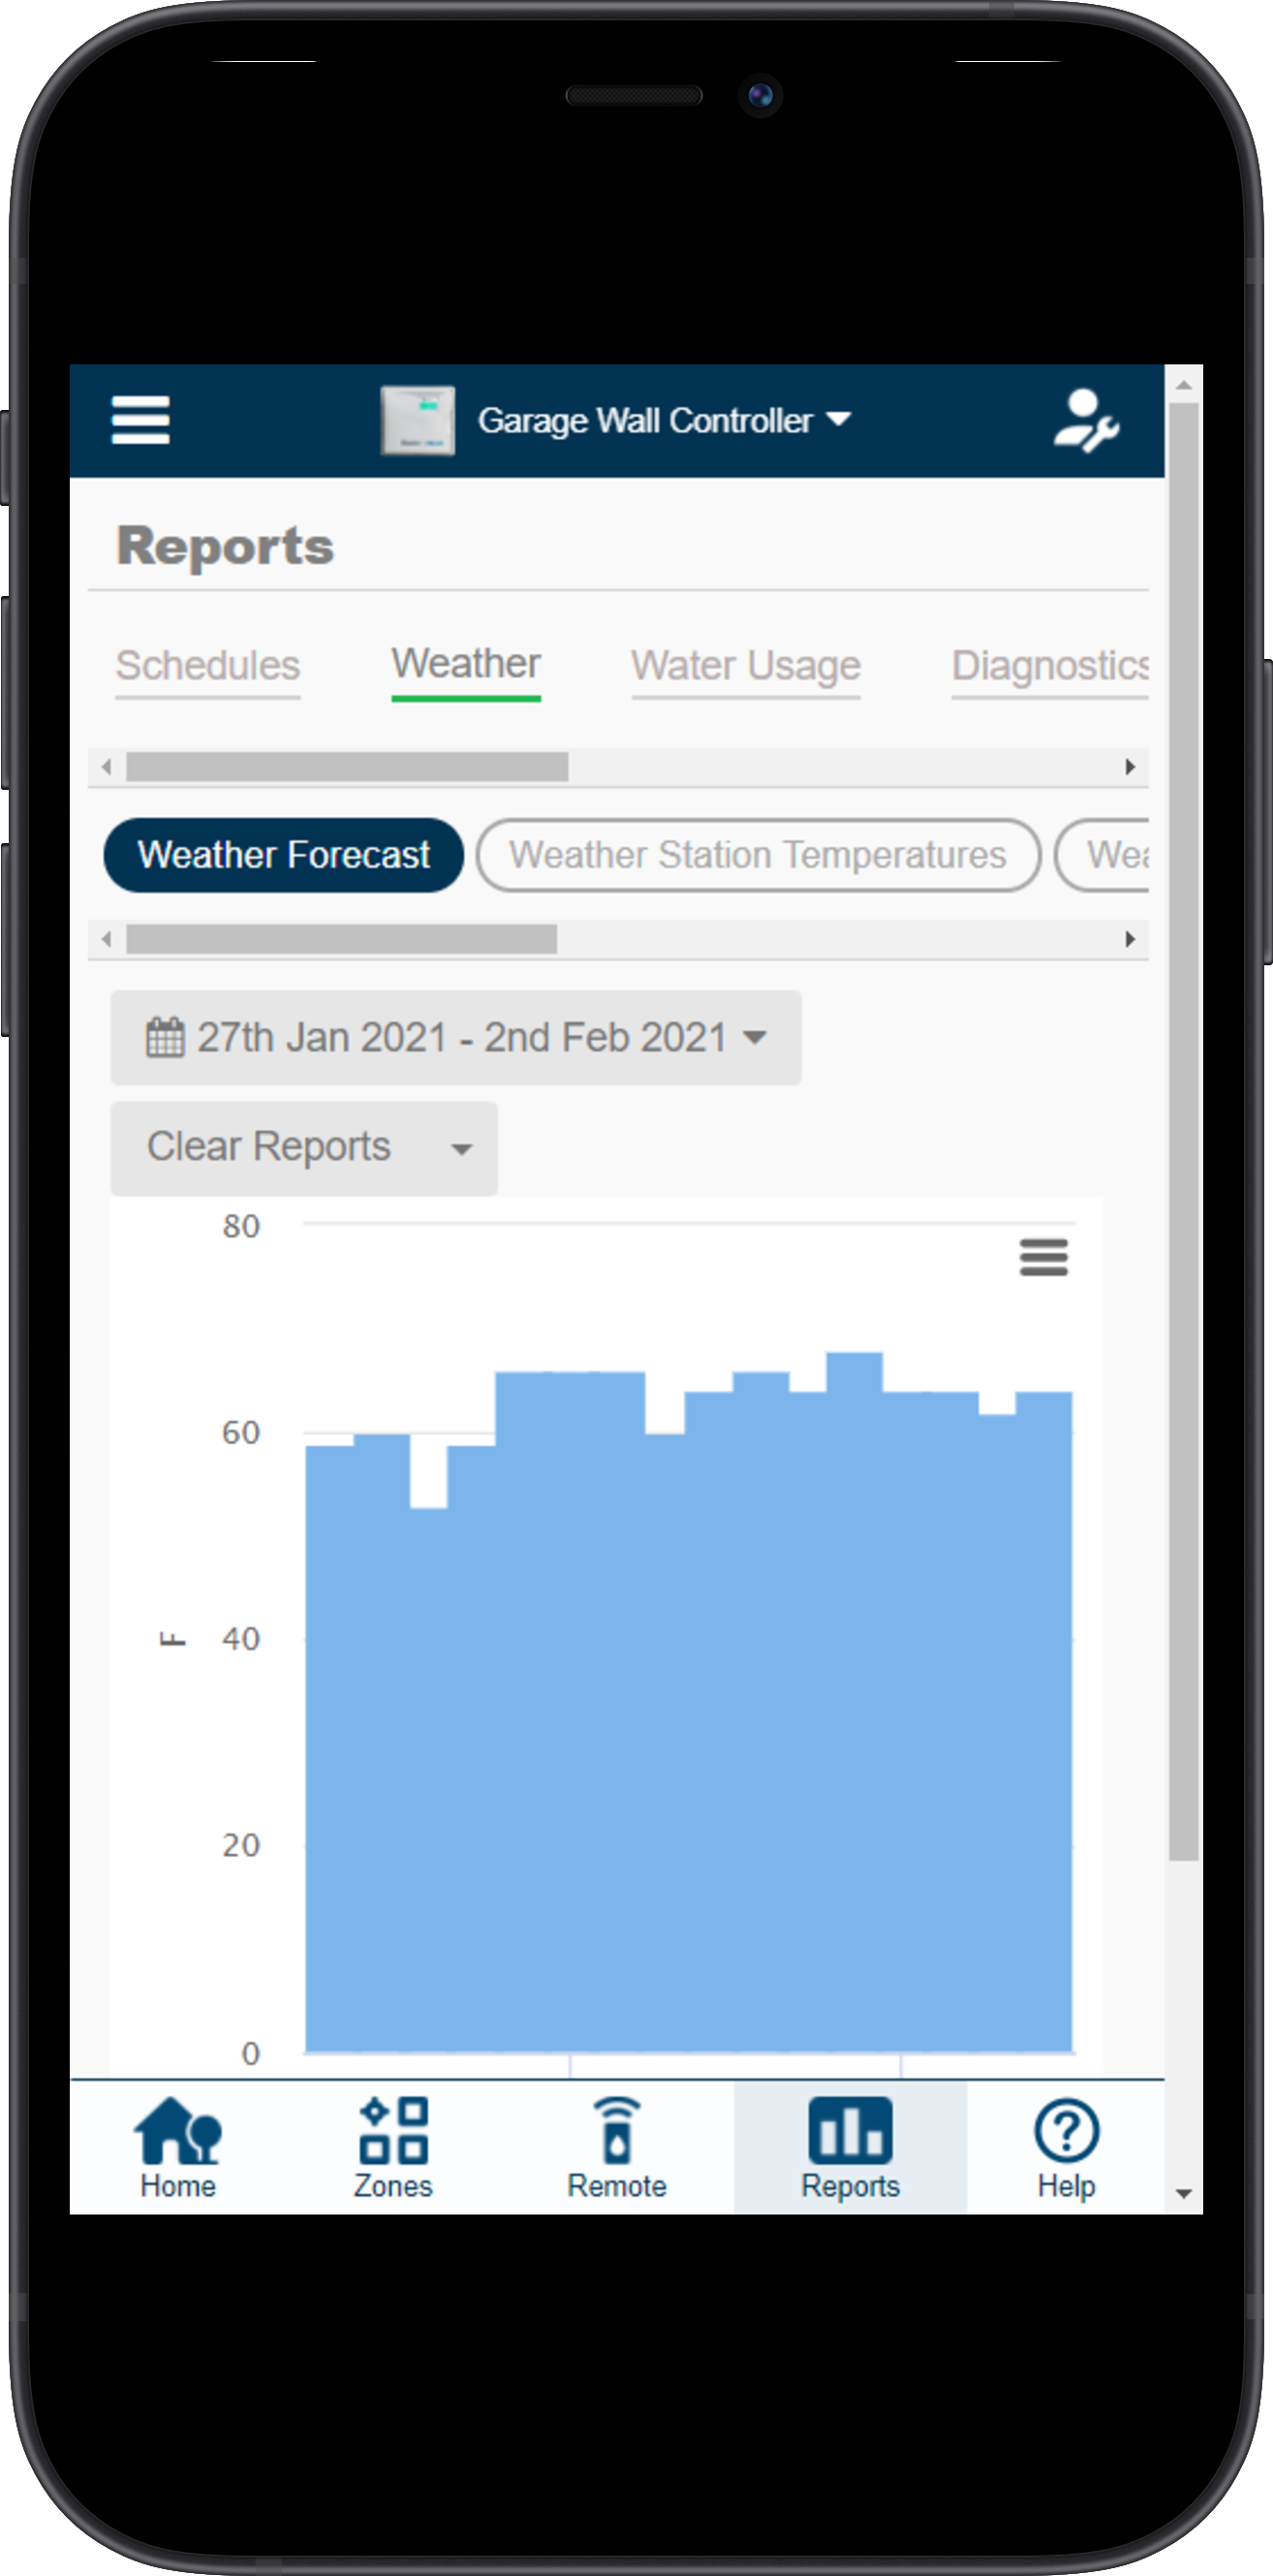
Weather reports will allow you to access all the necessary weather information when connected to a single station or multiple stations if on the Enthusiast plan. Use the settings on the SCHEDULES report tab to change or view any of the following:
- Weather Forecast
- Weather Station Temperatures
- Weather Station Rainfall
- Weather Station Wind Gust
- Evapotranspiration (ET)
- Download a report to Excel, clear all report data, or refresh a report
You can view reporting history for up to 30 days on the HOME plan and 365 days on the ENTHUSIAST plan. For upgrading plans, visit the support section here.
| Steps | Screenshot |
Please view the chart below for a brief description of each of the reports. |
 |
| Weather | |
| Report Name | Description |
| Weather Forecast |
Show the historical weather forecast plus the next 3 days, forecast. Your controller will use this forecast to adjust your watering schedule. |
| Weather Station Temperatures |
Shows daily maximum temperatures for each weather station to which the controller is subscribed. You can click on the weather station names at the bottom of the report to show their information in the report or exclude it. |
| Weather Station Rainfall |
Shows daily rainfall for each weather station to which the controller is subscribed. You can click on the weather station names at the bottom of the report to show their information in the report or exclude it. |
| Weather Station Wind Gust |
Shows wind gusts for each weather station to which the controller is subscribed. You can click on the weather station names at the bottom of the report to show their information in the report or exclude it. Hover over any wind gust bar to see further information. |
| Evapotranspiration (ET) | Shows daily evapotranspiration (the process by which water is transferred from the land to the atmosphere by evaporation from the soil and other surfaces and by transpiration from plants) for each weather station to which the controller is subscribed. You can click on the weather station names at the bottom of the report to show their information in the report or exclude it. |
How to View Saved Reports
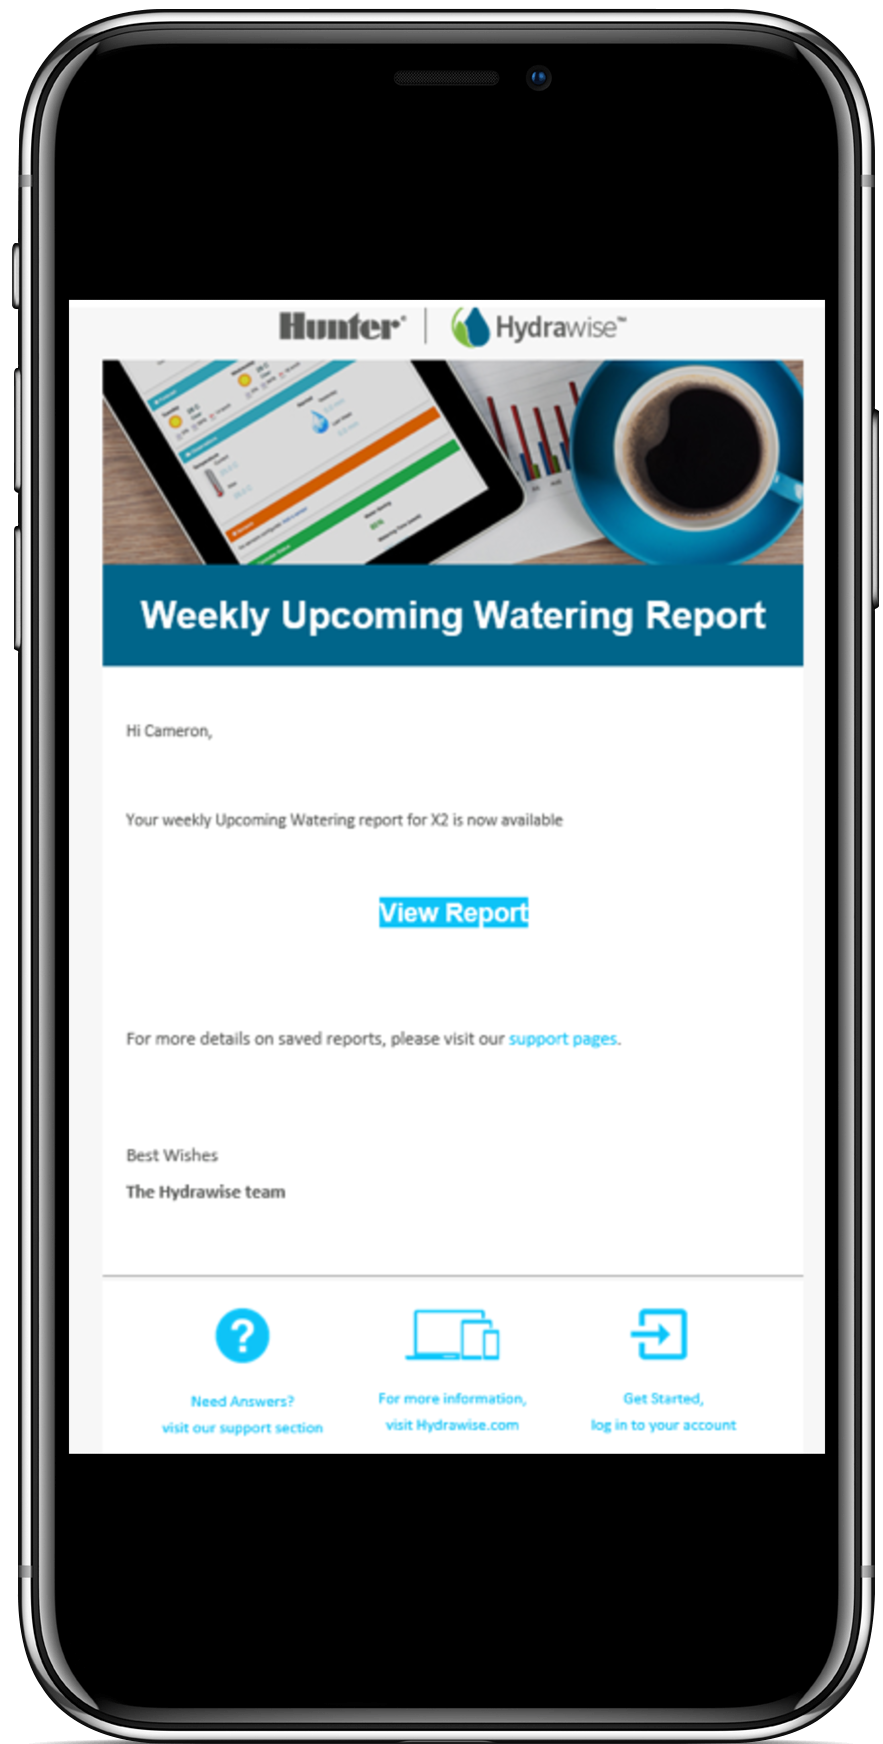
If your account is managed by a contractor, they can set up weekly, monthly, or yearly reports that will appear in the SAVED REPORT section. A link to the report can be delivered via email or via the Hydrawise app. There are several reports that can be configured by a contractor based on WATER USAGE and UPCOMING WATERING. Please contact your contractor for setup details.
You will receive a similar message in the screenshot to the right.

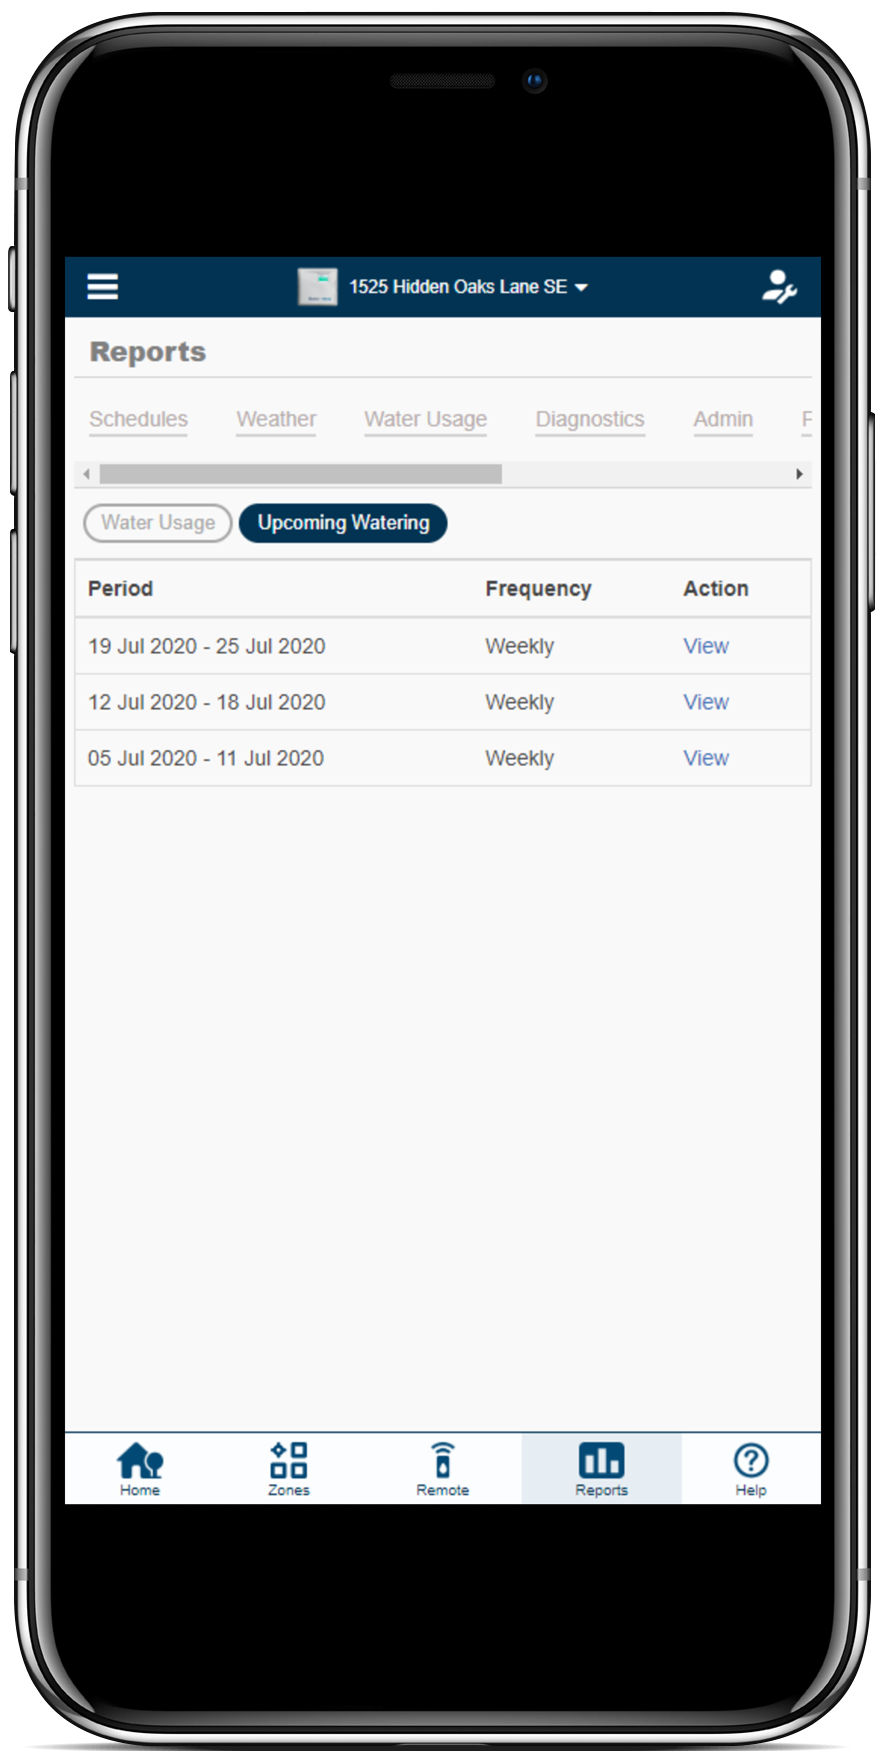
- Select the REPORTS
 icon on the lower righthand side of the app.
 - Scroll through the REPORTS under-report view at the top.
- Select SAVED REPORTS.
- Choose a period date then select the action titled VIEW.
- Share is desired by selecting the share icon
 on the upper right-hand side of screen.

Why did my system not water and it shows not scheduled?
If the irrigation system does not water on the scheduled day, you may have a cancellation caused by a sensor or a water trigger. The Reports tab titled will indicate if either has occurred (e.i., wet rain sensor).
| View Canceled Watering |
- Sign in to your Hydrawise account.
- Click the Reports icon (
) at the bottom or click Reports if using your computer (PC) from your home Dashboard.
- Click the Report Schedule.
- View the zones that were scheduled to run that day. If you see lines crossed through any of the zones, this indicates a Sensor or Water Trigger canceled the watering.
| Sensors |
Sensors will automatically cancel irrigation 30 days in advance but revert to the normal state (not stopping irrigation) when the sensor switches back. This could be several hours or days as it depends on the current climate conditions.
- Aborted Due to Sensor Input
- Weather sensor is active (rain sensor, wind sensor or moisture sensor) Schedule will cancel indefinitely until sensor status returns to normal.
| Water Triggers |
Scheduling will be canceled based on how each trigger is set.
- Aborted Due to High Probability of Rain
- The forecast chance of rain is higher than the trigger, and the schedule will reset/check the following day again.
- Aborted Due to High Forecast of Wind Speed
- Local wind speed is higher than the mph set in the trigger, the schedule will reset/check the following day again.
- Not Watering Due to Low Temperature
- Forecast High Temperature is lower than the temperature set in the trigger, the schedule will reset/check again the following day
- Aborted Due to High Weekly Rainfall
- The total amount of rain for the last 7 days is higher than the trigger, the schedule will reset after the last 7 days is less than trigger
- Aborted Due to Rainfall Higher last 24hr
- Previous day’s rainfall is higher than set in the trigger, the schedule will reset/check again the following day
Reports
You can access reports for your controllers by selecting REPORTS from the main menu or selecting REPORTS at the bottom for the mobile version. Use the settings on the report tab to the right of the screen to change the following:
- Change the date range for the report
- Clear all report data
- Download a report to Excel
- Refresh a report
- View all report data
Note: A line crossed through the zones in the Watering Schedule indicates the cycles were canceled due to a wet sensor or water trigger set.
- Select the REPORTS tab on the left-hand side on the dashboard.
- Select one of the five report options to view the data.
| Step 1 |
| Step 2 |
Below you will find all the different report names and descriptions of each.
| Schedule | |
| Report Name | Description |
| Watering Schedule |
Shows the scheduled watering time for each zone. You can hover over each schedule to see more details about the planned watering. |
| Watering History (Actual) |
Shows actual completed watering time for each zone. You can hover over each watering time to see more details about the watering. |
| Weather | |
| Report Name | Description |
| Weather Forecast |
Show the historical weather forecast plus the next 3 days, forecast. You controller will use this forecast to adjust your watering schedule. |
| Weather Station Temperatures |
Shows daily maximum temperatures for each weather station to which the controller is subscribed. You can click on the weather station names at the bottom of the report to show their information in the report or exclude it. |
| Weather Station Rainfall |
Shows daily rainfall for each weather station to which the controller is subscribed. You can click on the weather station names at the bottom of the report to show their information in the report or exclude it. |
| Weather Station Wind Gust |
Shows wind gusts for each weather station to which the controller is subscribed. You can click on the weather station names at the bottom of the report to show their information in the report or exclude it. Hover over any wind gust bar to see further information. |
| Evapotranspiration (ET) | Shows daily evapotranspiration for each weather station to which the controller is subscribed. You can click on the weather station names at the bottom of the report to show their information in the report or exclude it. |
| Water Usage | |
| Report Name | Description |
| Water Saving |
The Water Saving is calculated by comparing the original Watering Schedule per the Zones page with the Watering History (actual). Water Savings = the planned irrigation minus the Predictive Weather changes or sensor stops plus any manual watering over a rolling 7 days. |
| Flow Meter Measurements |
If you have a flow meter installed, this report shows reported flow for each of your controller’s zones. |
| Total Water Usage |
Shows daily water usage as recorded by each flow meter. Also shows minimum and maximum water usage for any flow meter across the period as well as the average and total water usage. You can click on the flow meter names at the bottom of the report to show their information in the report or exclude it. Hover over any flow meter bar to see how many zones were active at the time. |
|
Flow Rates (per minute) |
If you have a flow meter installed, this report shows instantaneous flow rates each time the controller records flow. Hover over any dot to see the flow rate and the number of zones active at the time. NOTE: Historical flow reports will show up to 7 days. |
|
Sensor Levels |
If you have a rain sensor, moisture sensor or any other ‘level’ based sensor configured this report will show the historical status of your sensor (open or closed). |
| Smart Water Balance | Shows the irrigation balance for each zone on a given day. Also shows the minimum and maximum irrigation balance over the report period. You can click on the zone names at the bottom of the report to show their information in the report or exclude it. Hover over the graph to see information on evapotranspiration, rainfall and irrigation amounts. |
| Virtual Solar Sync | Shows the Solar Sync adjustment by a date and percentage. |
| Diagnostics | |
| Report Name | Description |
|
Solenoid Load |
150 – 449mA = 1 solenoids 450 – 749mA = 2 Solenoids 750 + = 3 solenoids Greater than 800 mA will initiate an overload on the controller. |
| Historical Weather | |
| Report Name | Description |
|
Monthly Evapotranspiration and Rainfall |
Shows the historical ET and rainfall in your area. This data is based on a 12 year average |
|
Monthly Temperature and Rainfall |
Shows the historical temperature and rainfall in your area. This data is based on a 12 year average. |
Exporting Reports
The instructions below explain how to download the report into an Excel document.
To download your reports in Excel, click on the REPORTS TAB on the left-hand side of the home dashboard. After highlighting one of the download options listed below, you can click the download tab to automatically save to an excel file on your computer.
Download Options Include:
- Day
- Week
- Month
NOTE: The free Home Plan provides up to 30 days of reporting, and the Enthusiast Plan provides up to 365 days of reporting.